Interactivity
Due by 11:59 PM on Monday, October 30, 2023
For this exercise, you’ll use whatever data you want to make a plot and make it interactive. Use a dataset from a past exercise, use one of the built-in datasets like mpg or gapminder from the {gapminder} package, download stuff from the World Bank using the {WDI} package, or use something from this list of datasets. Whatever you want.
THIS IS DIFFERENT
This exercise is a little different from past ones because you will not knit to PDF or Word. Pay attention to the instructions below.
The example for this week’s session will be helpful as you tinker with ggplotly(), and the resources listed at the bottom of the example will be helpful for making a dashboard.
You’ll be doing all your R work in R Markdown. You can download a zipped file of a pre-made project here:
And as always, if you’re struggling, please talk to me and use Slack and talk to your classmates! Don’t suffer in silence!
Instructions
If you’re using R on your own computer, download this file, unzip it, and double click on the file named
exercise-10.Rproj:10-exercise.zipYou’ll need to make sure you have these packages installed on your computer:
tidyverse,plotly,flexdashboard. If you try to load one of those packages withlibrary(tidyverse)orlibrary(plotly), etc., and R gives an error that the package is missing, use the “Packages” panel in RStudio to install it.(Alternatively, you can open the project named “Exercise 10” on Posit.cloud and complete the assignment in your browser without needing to install anything. This link should take you to the project—if it doesn’t, log in and look for the project named “Exercise 10”.)
Rename the R Markdown file named
your-name_exercise-10.Rmdto something that matches your name and open it in RStudio.Complete the tasks given in the R Markdown file.
Fill out code in the empty chunks provided (you can definitely copy, paste, and adapt from other code in the document or the example page—don’t try to write everything from scratch!).
Here’s where this is all different this time. You will not upload a knitted PDF or Word file to iCollege, since those can’t handle interactivity. Instead, do this:
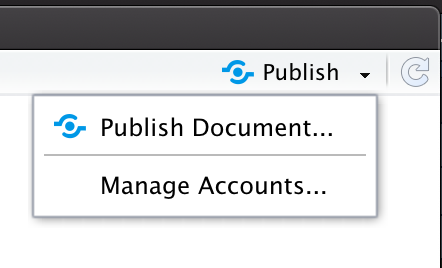
- Knit the document with Tasks 1 and 2 in it to HTML and publish it to RPubs using the “Publish document” menu in the preview of the knitted file. Take note of the URL.
Knit the dashboard from Task 3 to HTML and publish it to RPubs using the same menu. Take note of the URL.
In iCollege, paste the two URLs into the submission form for exercise 10 following this template:
Task 1 and 2: URL HERE
Task 3 dashboard: URL HERE