library(tidyverse)
library(gapminder)

gapminder_2007 <- gapminder %>%
  filter(year == 2007)

ggplot(gapminder_2007, aes(x = lifeExp)) +
  geom_histogram(binwidth = 5, color = "white", boundary = 0)
Tuesday October 3, 2023 at 2:44 PM
Hi everyone!
Great work with exercise 6 this week! You’re starting to get the hang of ggplot and R!
Just a couple quick common issues this week:
In exercise 6, a lot of you ran into issues with the GDP per capita histogram. The main issue was related to bin widths.
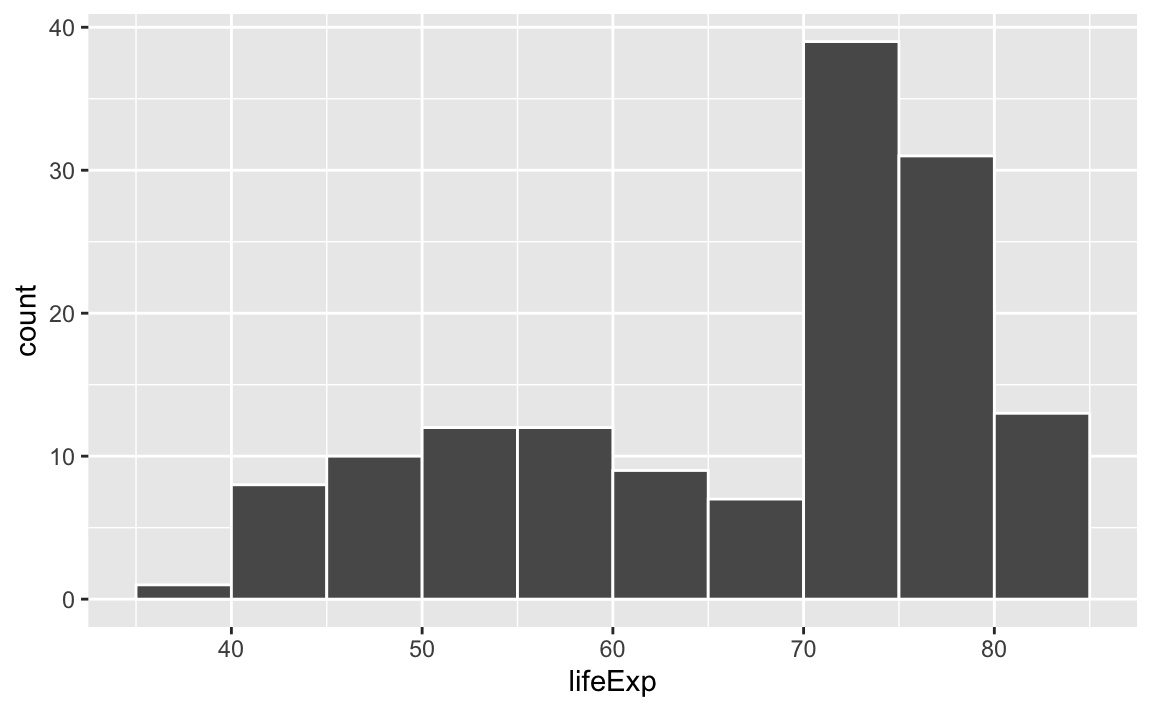
Histograms work by taking a variable, cutting it up into smaller buckets, and counting how many rows appear in each bucket. For example, here’s a histogram of life expectancy from gapminder, with the binwidth argument set to 5:
library(tidyverse)
library(gapminder)
gapminder_2007 <- gapminder %>%
filter(year == 2007)
ggplot(gapminder_2007, aes(x = lifeExp)) +
geom_histogram(binwidth = 5, color = "white", boundary = 0)
The binwidth = 5 setting means that each of those bars shows the count of countries with life expectancies in five-year buckets: 35–40, 40–45, 45–50, and so on.
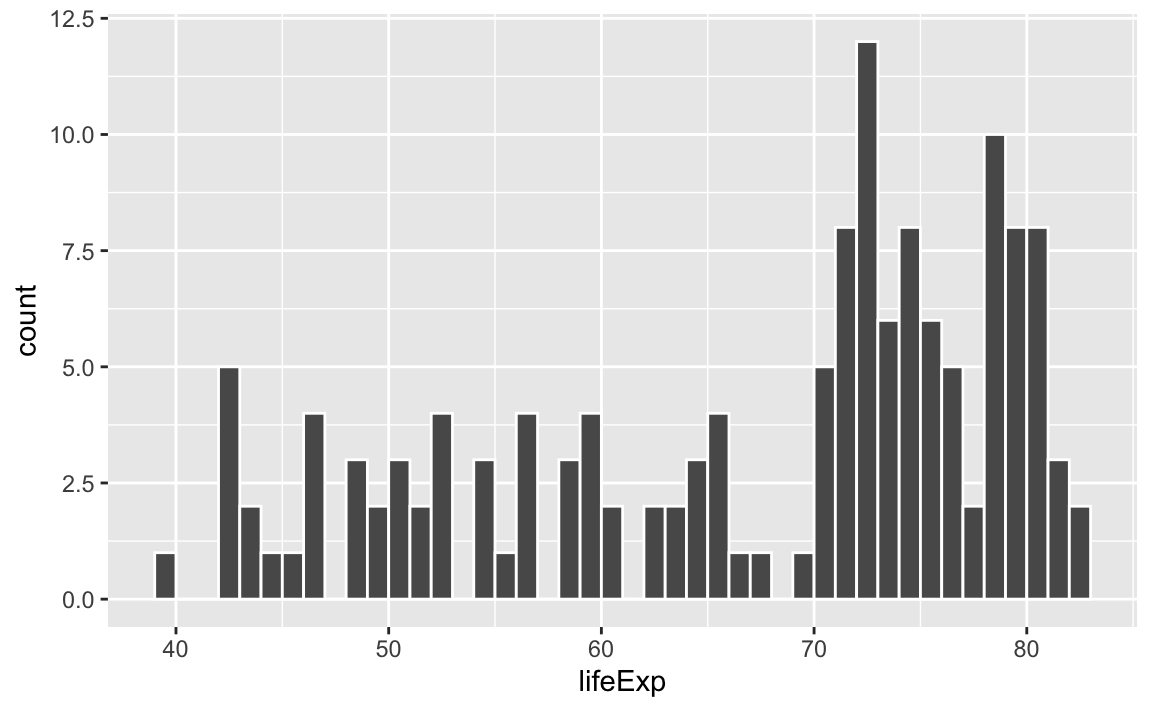
If we change that to binwidth = 1, we get narrower bars because we have smaller buckets—each bar here shows the count of countries with life expectancies between 50–51, 51–52, 52–53, and so on.
ggplot(gapminder_2007, aes(x = lifeExp)) +
  geom_histogram(binwidth = 1, color = "white", boundary = 0)
If we change it to binwidth = 20, we get huge bars because the buckets are huge. Now each bar shows the count of countries with life expectancies between 20–40, 40–60, 60–80, and 80–100:
ggplot(gapminder_2007, aes(x = lifeExp)) +
  geom_histogram(binwidth = 20, color = "white", boundary = 0)
There is no one correct good universal value for the bin width and it depends entirely on your data.
Lots of you ran into an issue when copying/pasting code from the example, where one of the example histograms used binwidth = 1, since that was appropriate for that variable.
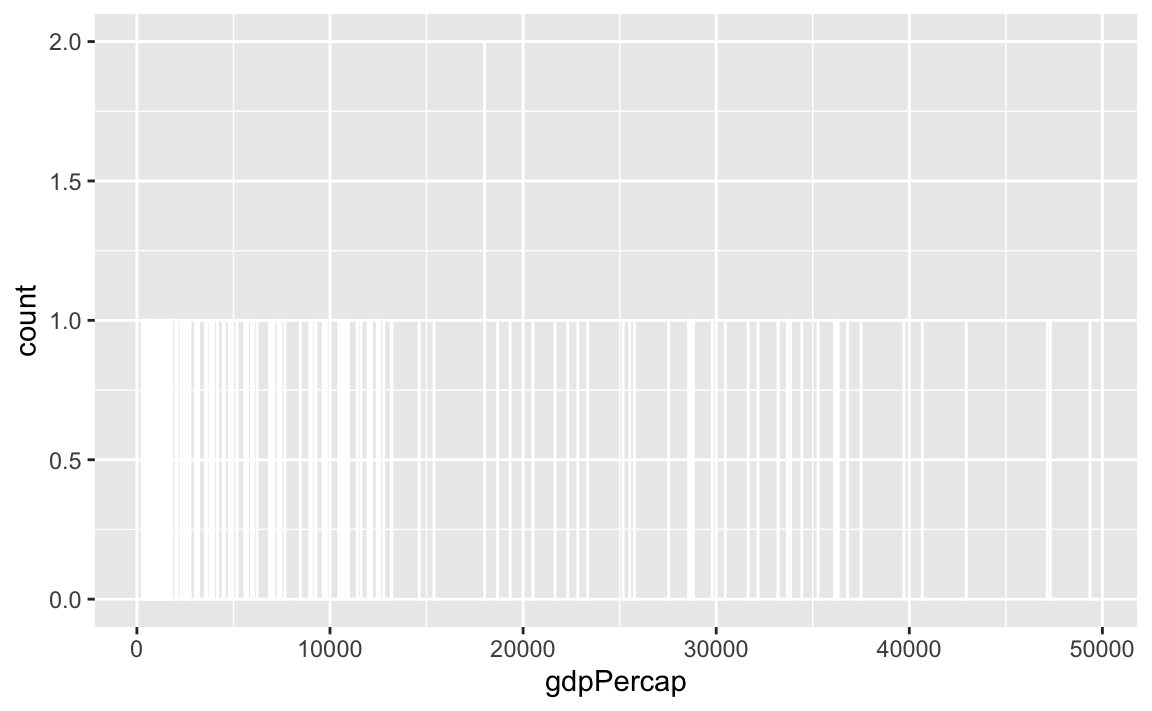
Watch what happens if you plot a histogram of GDP per capita using binwidth = 1:
ggplot(gapminder_2007, aes(x = gdpPercap)) +
  geom_histogram(binwidth = 1, color = "white", boundary = 0)
haha yeah that’s delightfully wrong. Each bar here is showing the count of countries with GDP per capita is $10,000–$10,001, then $10,001–$10.002, then $10,002–$10,003, and so on. Basically every country has its own unique GDP per capita, so the count for each of those super narrow bars is 1 (there’s one exception where two countries fall in the same bucket, which is why the y-axis goes up to 2). You can’t actually see any of the bars here because they’re too narrow—all you can really see is the white border around the bars.
To actually see what’s happening, you need a bigger bin width. How much bigger is up to you. With life expectancy we played around with 1, 5, and 20, but those bucket sizes are waaaay too small for GDP per capita. Try bigger values instead. But again, there’s no right number here!
ugly monospaced font and it flows off the edge of the page? Why?You’re used to indenting paragraphs in Word or Google Docs. First-line indentation is a normal thing with word processors.
Indenting lines is unnecessary with Markdown and will mess up your text.
For example, let’s say you type something like this:
    It was the best of times, it was the worst of times, it was the age of
wisdom, it was the age of foolishness, it was the epoch of belief, it was the
epoch of incredulity, it was the season of Light, it was the season of Darkness,
it was the spring of hope, it was the winter of despair, we had everything
before us, we had nothing before us, we were all going direct to Heaven, we were
all going direct the other way—in short, the period was so far like the present
period, that some of its noisiest authorities insisted on its being received,
for good or for evil, in the superlative degree of comparison only.

    There were a king with a large jaw and a queen with a plain face, on the
throne of England; there were a king with a large jaw and a queen with a fair
face, on the throne of France. In both countries it was clearer than crystal to
the lords of the State preserves of loaves and fishes, that things in general
were settled for ever.
That looks like Word-style text, with indented paragraphs. When you knit it, though, it’ll turn into code-formatted monospaced text that runs off the edge of the page:
It was the best of times, it was the worst of times, it was the age of wisdom, it was the age of foolishness, it was the epoch of belief, it was the epoch of incredulity, it was the season of Light, it was the season of Darkness, it was the spring of hope, it was the winter of despair, we had everything before us, we had nothing before us, we were all going direct to Heaven, we were all going direct the other way—in short, the period was so far like the present period, that some of its noisiest authorities insisted on its being received, for good or for evil, in the superlative degree of comparison only.

There were a king with a large jaw and a queen with a plain face, on the throne of England; there were a king with a large jaw and a queen with a fair face, on the throne of France. In both countries it was clearer than crystal to the lords of the State preserves of loaves and fishes, that things in general were settled for ever.
That’s because Markdown treats anything that is indented with four spaces as code, not as text.
You shouldn’t indent your text. Instead, add an empty line between each paragraph to separate them:
It was the best of times, it was the worst of times, it was the age of
wisdom, it was the age of foolishness, it was the epoch of belief, it was the
epoch of incredulity, it was the season of Light, it was the season of Darkness,
it was the spring of hope, it was the winter of despair, we had everything
before us, we had nothing before us, we were all going direct to Heaven, we were
all going direct the other way—in short, the period was so far like the present
period, that some of its noisiest authorities insisted on its being received,
for good or for evil, in the superlative degree of comparison only.

There were a king with a large jaw and a queen with a plain face, on the
throne of England; there were a king with a large jaw and a queen with a fair
face, on the throne of France. In both countries it was clearer than crystal to
the lords of the State preserves of loaves and fishes, that things in general
were settled for ever.
↑ that will turn into this ↓
It was the best of times, it was the worst of times, it was the age of wisdom, it was the age of foolishness, it was the epoch of belief, it was the epoch of incredulity, it was the season of Light, it was the season of Darkness, it was the spring of hope, it was the winter of despair, we had everything before us, we had nothing before us, we were all going direct to Heaven, we were all going direct the other way—in short, the period was so far like the present period, that some of its noisiest authorities insisted on its being received, for good or for evil, in the superlative degree of comparison only.
There were a king with a large jaw and a queen with a plain face, on the throne of England; there were a king with a large jaw and a queen with a fair face, on the throne of France. In both countries it was clearer than crystal to the lords of the State preserves of loaves and fishes, that things in general were settled for ever.